No one can argue that having a top-notch IDE, like Visual Studio, which allows for code management, formatting, context-aware tools (e.g., Intellisense) and debugging is a significant productivity improvement for developing great code. So when I started developing for embedded platforms, like the BeagleBone Black (BBB), and especially using node.js as the application core, I often wished I had the development tool set that is available for desktop and server programmers.
Fortunately, Microsoft has developed and open-sourced a Visual Studio extension for Node.js projects, called unsurprisingly, Node.js Tools for Visual Studio or NTVS, for short. In addition to helping us code in Javascript and node, one of the less documented goodies is a remote debugger, that helps us troubleshoot applications running on embedded targets. In this post, we’ll reuse the bbbTemp application, which reads and displays temperature and demonstrate how we can remote debug it as it runs on a BeagleBone Black.
Installing the NTVS Extension
Obviously, we’ll need to download and install the NTVS tool set. You’ll like want to first make sure that you have Visual Studio Community Edition 2015 installed, but once you do, then install NTVS 1.1.
Setting up the Project
With NTVS installed, we’ll set up our project. To do this, we’ll start with a fresh clone of the bbbTemp, which is located bitstobrowser bbtemp repo:
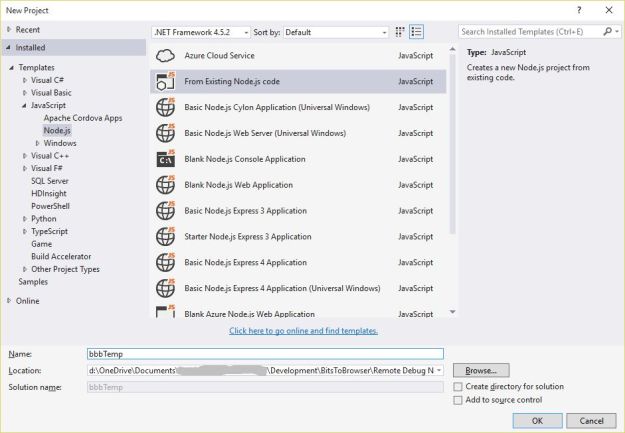
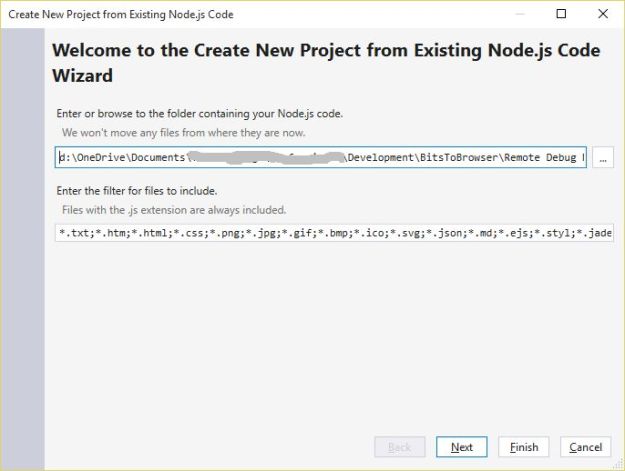
Start up Visual Studio Community Edition 2015 and create a new project based on existing node source:
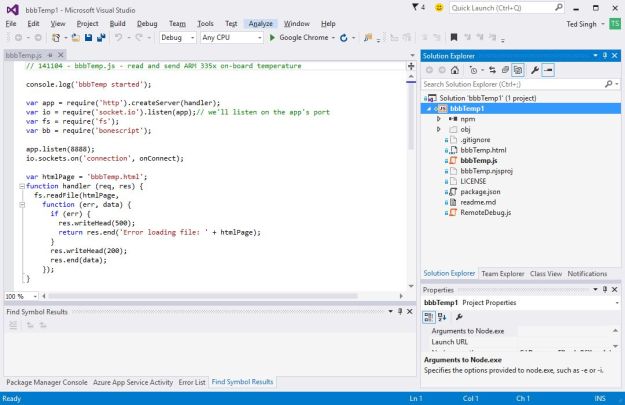
We now have our project in Visual Studio:
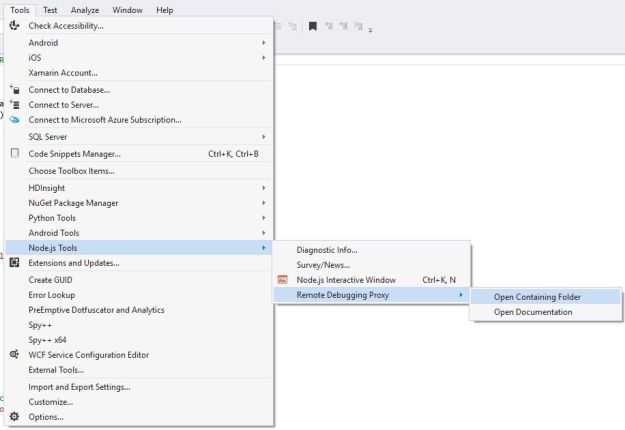
To debug a remote Node application, we need to add RemoteDebug.js to our project. This file is a part of the NTVS tool set and acts as the remote debugging proxy interface to Visual Studio. While this file is mentioned in the Advanced Debugging section of the NTVS documentation, it wasn’t obvious where to find it. The easiest way to find it is from Visual Studio’s menu system – use Tools / Node.js Tools / Remote Debugging Proxy / Open Containing Folder.
Preparing the Target Machine for Debugging
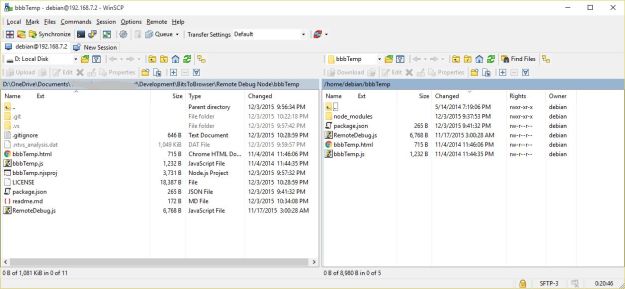
While there maybe a way to transfer files from within Visual Studio, I currently do this using WinSCP or via a github repo. For this post, we’ll use WinSCP to transfer the project to our BeagleBone Black target:
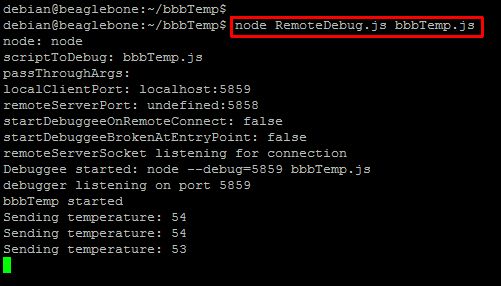
Using a SSH session, we’ll start our node application, using the RemoteDebug.js proxy to the application. To do this, we simply use the following command format:
$ node RemoteDebug.js (application)
For example:
Debugging the Remote Node App from Visual Studio
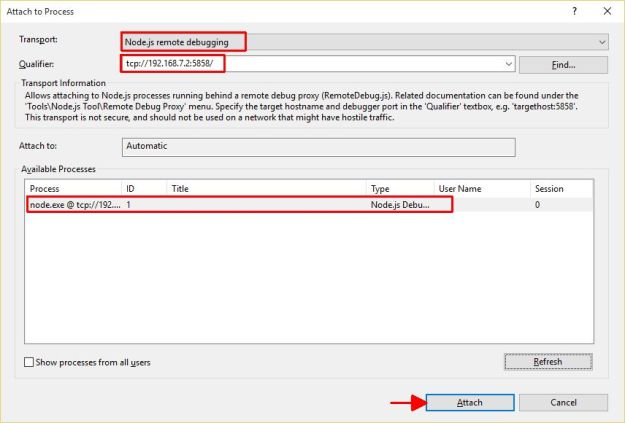
With the node application running, we will attach to it from Visual Studio and prepare do some debugging. Use the Debug / Attach to Process menu command to bring up the Attach to Process dialog and select Node.js remote debugging as the Transport and use the IP Address with port 5858 as the Qualifier. Use the refresh button to find your target device and then Attach:
Once attached, you now set breakpoints and inspect data, all from the comfort of Visual Studio:
Related Topics …
While I’ve shown this for a BeagleBone Black, it’s absolutely conceivable that the very same process could be used for debugging remote Windows IoT embedded targets – I may explore this idea in a subsequent post.
Additionally, there are some manual steps I took to transfer files to our target using WinSCP or a common git repo, but I am investigating how we might publish edits and launch debugging directly from Visual Studio, saving us from dropping out of the IDE.


